
Charted: AI Articles Have Overtaken Human Written Ones
Mapped: The States Where Businesses Use AI Most
Ranked: The Smartest AI Models of 2026
Ranked: AI Models U.S. Businesses Pay For
Ranked: The Companies That Sell the Most AI Chips
Ranked: The World’s 50 Largest Banks by Assets
Every S&P 500 Company in One Giant Chart
SpaceX’s IPO Would Make It a Top 10 Company Globally
Charted: The Global Stock Selloff as Oil Fears Rise
Warren Buffett vs. the S&P 500: Growth of $100 (1965–2025)
Ranked: America’s Most Reliable Companies
Mapped: Where the Gender Pay Gap Is Widest
Ranked: The World’s 20 Busiest Ports
Mapped: Where Young Americans Still Own Homes
Mapped: Where Housing Takes the Biggest Share of Income
Ranked: The Biggest Social Media Platforms in 2026
Mapped: Europe’s Social Media Gap by Country
Mapped: Social Media Use Among Europe’s Youth
Charted: AI Articles Have Overtaken Human Written Ones
Mapped: The States Where Businesses Use AI Most
Mapped: Where the Gender Pay Gap Is Widest
Mapped: The States Paying the Most for Gas Relative to Income
How Government Debt Has Diverged Across Major Economies (2005–2025)
Ranked: Where Wages Go Furthest Around the World
The $126T Global Economy in One Giant Chart
Mapped: The U.S. Is Split on Legal Marijuana—Here’s Where
Mapped: Life Expectancy by U.S. State
Mapped: U.S. States With the Highest Diabetes Rates
Mapped: Adult Obesity Rates Across All 50 U.S. States
Ranked: The World’s 10 Deadliest Viruses by Fatality Rate
Mapped: Where the Gender Pay Gap Is Widest
Charted: The Global Fertility Divide
Ranked: Where the World’s Migrants Live Today
Mapped: Europe’s Social Media Gap by Country
Mapped: Every Country’s Fertility Rate as Births Decline Worldwide
Which Countries Use the Most Electricity?
Ranked: The World’s Largest Oil Stockpiles
Ranked: The Fastest-Growing Battery Materials Since 2020
China Produces More Coal Than the Rest of the World Combined
Coal Still Generates More Electricity Than Any Other Source
Mapped: The States Banning Phones in Schools
Mapped: Where the Gender Pay Gap Is Widest
Mapped: The States Paying the Most for Gas Relative to Income
Mapped: Where Young Americans Still Own Homes
Mapped: Where Housing Takes the Biggest Share of Income
These Countries Hold Most of the World’s Copper
Ranked: Central Banks Buying and Selling Gold in 2026
Ranked: U.S. Import Reliance for 37 Critical Minerals
Visualizing the Critical Minerals Powering the AI Boom
Ranked: The Critical Minerals Lost to U.S. Mining Waste, by Tonnage
Just One Lake on Earth Is Over a Mile Deep
Ranked: Where Emissions Are Rising Fastest
How Much Clean Energy Have Countries Added Since 2015?
Mapped: Only One Country Can Feed Itself Fully
Ranked: The Countries Building the Most Nuclear Power
Published
on
By![]() See this visualization first on the Voronoi app.
See this visualization first on the Voronoi app.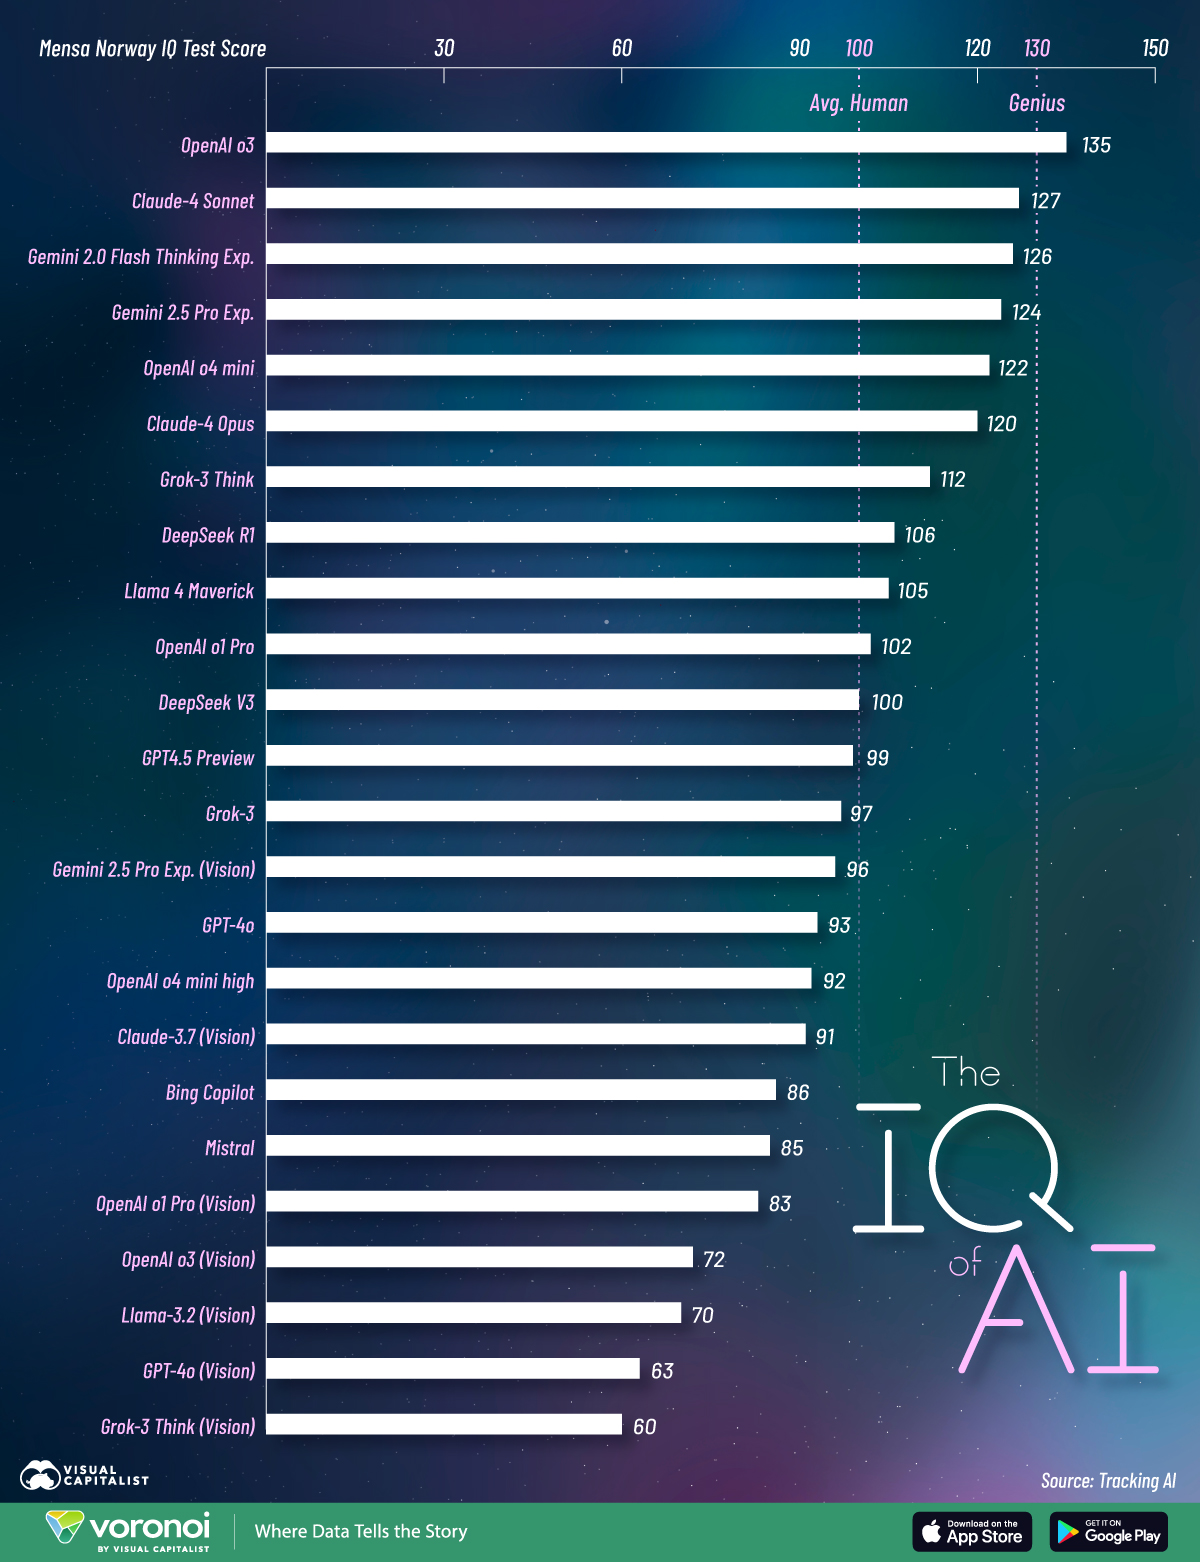
Use This Visualization
This was originally posted on our Voronoi app. Download the app for free on iOS or Android and discover incredible data-driven charts from a variety of trusted sources.
Mirror mirror on the wall, who’s the smartest AI of them all?
Artificial intelligence is designed to be intelligent. But how do today’s leading AI models stack up in human IQ terms, and which ones are the smartest?
This infographic ranks the smartest AI models based on their performance on the Mensa Norway IQ test, with data compiled by Tracking AI. The Mensa test is a widely recognized and highly difficult IQ exam used to evaluate human intelligence.
For context, the average human IQ score ranges from 90 to 110, while a score above 130 is typically considered genius-level.
Topping the chart is OpenAI’s text-only o3 model, scoring a 135 on the Mensa IQ test, which puts it in the “genius” category. As a part of ChatGPT, it’s also among the world’s most popular AI tools.
Anthropic’s Claude-4 Sonnet and Google’s Gemini 2.0 Flash Thinking follow closely with IQ scores of 127 and 126, respectively. Furthermore, new iterations like the Gemini 2.5 Pro and OpenAI o4 mini both scored over 120, above the average human IQ range.
Overall, these high scores prove that leading AI models are now operating at high levels of intelligence, with some even surpassing the smartest human minds.
However, what’s more surprising is that all of the top 10 smartest AI models are text-only models that cannot read or process images.
Based on IQ scores, it seems like reasoning through words is still a much stronger suit for AI than interpreting and solving visual images and puzzles.
The bottom five AI models by IQ scores are all multimodal models with the ability to read and process images. In particular, OpenAI’s GPT-4o (Vision) and xAI’s Grok-3 Think (Vision) landed far below the human average, scoring 63 and 60 on the test, respectively.
Still, the results are telling: AI isn’t just mirroring human intelligence, it’s even outscoring us in certain areas of cognition and reasoning.
See what humans are using AI for in 2025, in this infographic on the Voronoi app.
Mapped: The Biggest Tech Talent Hubs in the World
ChatGPT Lags Far Behind Google in Daily Search Volume
Ranked: America’s Most Reliable Companies
Ranked: The Fastest-Growing Battery Materials Since 2020
AI Week: 6 Insights Shaping the AI Economy
Charted: AI Articles Have Overtaken Human Written Ones
Mapped: The States Where Businesses Use AI Most
Ranked: The Smartest AI Models of 2026
Billions of people use social media today. The biggest three platforms, however, are all owned by just one company.
Published
on
By
See visuals like this from many other data creators on our Voronoi app. Download it for free on iOS or Android and discover incredible data-driven charts from a variety of trusted sources.
The world’s largest social media platforms now rival countries in scale, with several apps serving more than one billion monthly users.
This graphic highlights the world’s most popular social media platforms using 2026 data from Salesforce, which counts the number of monthly active users for each platform.
Facebook remains the world’s biggest social media platform with more than 3.1 billion monthly users, reflecting roughly 40% of the global population.
Facebook, created in 2004, is owned by Meta (formerly Facebook Inc.), one of the world’s largest companies by market capitalization.
Yet Meta’s dominance extends well beyond Facebook, as it also owns runners-up Instagram and WhatsApp (both 3 billion). Meta acquired Instagram for just $1 billion in 2012, and acquired WhatsApp two years later for nearly $20 billion.
The table below lists the 15 most popular social media platforms worldwide alongside their owners and monthly active users.
While Facebook is popular with people of all ages, Instagram has become especially popular among young adults and millennials. Meanwhile, WhatsApp has become the world’s most widely used messaging app and is essential for communication in countries like Brazil and India.
Beyond the Big 3, Meta also owns Messenger (1 billion), another popular messaging app integrated with Facebook, as well as Threads (400 million), an Instagram offshoot designed to compete with X and its roughly 650 million users.
While most of the world’s top social media platforms have historically been American, Chinese companies have rapidly expanded their influence in recent years.
Within China itself, Tencent’s WeChat (1.4 billion) has become the country’s primary digital platform, extending beyond messaging to include payments, shopping, and gaming.
Then there’s ByteDance, which has reshaped the global social media landscape. The company created Douyin (755 million) for the Chinese market and its international counterpart TikTok (2 billion), which has become one of the world’s fastest-growing social platforms.
TikTok’s widespread popularity, especially among younger users, has also triggered regulatory scrutiny and restrictions in countries including India and the United States.
Following growing U.S. restrictions on TikTok, ByteDance agreed to enter a joint venture with American companies in 2025.
When social media first originated in the 2000s, it was designed for young adults to stay connected. Facebook famously wanted to put the entire college experience online. However, since then social media has extended far beyond its initial purpose.
YouTube (2.5 billion) is the largest video-sharing site in the world, while Reddit (850 million) has become a massive online forum for people to congregate around shared interests.
Finally, there’s LinkedIn (310 million). The social networking platform was acquired by Microsoft for over $26 billion in 2016 and is today a central hub for working professionals in various sectors to connect, network, and find or advertise jobs.
Is there a generational component? Find out with What are Gen Z’s Favorite Social Media Platforms? on Voronoi.Use This Visualization
An overwhelming majority of Europeans are on social media today. Germans and Italians, however, are more reluctant.
Published
on
By
See visuals like this from many other data creators on our Voronoi app. Download it for free on iOS or Android and discover incredible data-driven charts from a variety of trusted sources.
Social media use across Europe varies sharply by country, creating a clear gap between the continent’s most and least connected populations.
This map shows the share of adults active on social networking sites across Europe, based on 2025 data from Eurostat and Ofcom. Being “active” in this case involves creating a profile, posting messages, sharing, commenting, or otherwise contributing to a social networking site.
While adoption exceeds 80% in several northern countries, it drops to 56% in Italy and 59% in Germany, two of Europe’s largest economies. Overall, the European average sits at 74%, masking these wide differences in usage.
Northern Europe stands out as the region with the highest social media adoption rates.
Denmark leads the continent in social media use (90%), followed closely by Norway (89%). Sweden and the Baltic states of Estonia, Latvia, and Lithuania trail slightly behind in the 70–79% range.
This data table shows social media usage rates across European countries.
Northern Europe’s high usage reflects early and widespread adoption of digital technologies.
Estonia, for example, has earned the moniker “e-Estonia” due to its tech-savvy society and government, while companies ranging from Finland’s Nokia to Sweden’s Spotify rank among Europe’s leading digital success stories.
Even with this reputation, some Scandinavian governments are considering social media bans for children. Denmark, as the continental leader in online activity, is weighing a ban on children’s creation of social media profiles before age 15, or 13–14 with parental consent.
Western Europe has long included some of the continent’s most globalized countries. In 2005, university students in the United Kingdom were the first outside North America to join Facebook. Today, 89% of UK adults are active on social media.
However, beyond the UK, social media activity is more limited than in the Nordics. France counts 71% of its adult population on social networking sites, just ahead of Spain and Portugal (both 70%).
For their part, the Benelux countries show an interesting contrast: 81% of Dutch adults use social media, compared to 67–68% in Belgium and Luxembourg.
Italy has the lowest social media usage rate in Europe, with just 56% of adults active on social networks. This represents a gap of more than 30 percentage points compared to countries like Denmark, Norway, or the UK.
The contrast also appears generational, as over three-quarters of Italian teens self-report being addicted to their phones.
Germany (59%) is the only country near Italy’s low rate of social media usage. German society appears more divided on the benefits and drawbacks of social networking sites, with nearly half of surveyed Germans in 2025 saying they would rather live in a world without social media.
To learn more about this topic, check out the What are Gen Z’s Favorite Social Media Platforms? on Voronoi.
Ranked: The World’s Most Powerful Passports in 2026
Mapped: What It Takes to Be Upper-Middle Class in Every State
Mapped: America’s Best States to Live In
Ranked: Who Uses the World’s Coal?
Ranked: America’s Top Non-Ivy League Universities
Mapped: The World’s Most (and Least) Religiously Diverse Countries
Europe’s $32 Trillion Economy, by Country
Mapped: Gas Prices Worldwide, From $0.09 to $15.65
Copyright © 2026 Visual Capitalist | Privacy Policy